Lifecycle of a Prompt on My Old PC Home Lab
I have spent years looking at infrastructure as a chain of small, inspectable things: a packet, a process, a file descriptor, a queue. Local LLM inference initially felt less inspectable. I would send a sentence to Ollama, the GPU fans would wake up, and text would come back. That is not a satisfying boundary for an infrastructure engineer.
So I followed one request through my old PC home lab. This is not a benchmark and it is not a claim about every Ollama release or every model. It is a guided inspection of one measured run, on this machine:
- Linux host; NVIDIA RTX 3060 with 12 GB VRAM, 28 streaming multiprocessors (SMs), and compute capability 8.6.
- Ollama 0.20.7.
llama3.1:8b, chosen for the practical reason that it fits on this GPU.
I use three labels throughout:
- Measured here means I observed it on this host.
- Architecture means the normal job of this layer, explained in plain English.
- Verify locally means a tempting implementation detail that needs logs, source review, or tracing before I would state it as fact for this box.
1. The setup and request⌗
Before I sent anything, ollama ps showed no loaded models. The GPU was using roughly 25 MiB, which is background driver/desktop-level usage rather than evidence that the model was resident.
It is important to separate two similarly named tools before looking at the request:
ollama psis Ollama’s view of models it has loaded. ItsPROCESSORcolumn reports placement such as100% GPU; itsCONTEXTcolumn shows allocated context. It is the right view for model residency.- Linux
psis the operating system’s view of processes and threads. It is the right view for programs the OS scheduled. It does not know which model is loaded or how many CUDA threads are running.
Ollama documents ollama ps specifically as the way to inspect loaded models and GPU/CPU placement, and its context-length guide describes PROCESSOR and CONTEXT as the useful fields. Ollama: context length
Here is the request shape from my test. The exact prompt sentence is an awaiting-measurement placeholder: the supplied attachment that contained it is not available in this working copy, and I will not invent it. The recorded result says its rendered prompt evaluated to 22 tokens.
curl http://127.0.0.1:11434/api/generate \
  -H 'Content-Type: application/json' \
  -d '{
    "model": "llama3.1:8b",
    "prompt": "<paste the original 22-token test prompt here>",
    "stream": false,
    "keep_alive": "15m",
    "options": {
      "num_ctx": 4096,
      "num_predict": 128,
      "temperature": 0,
      "seed": 42
    }
  }'
The settings are intentionally boring, which makes them useful for learning:
-
modelnames the local model Ollama should schedule. -
promptis the user text. Unlessrawis requested, it is normally rendered through the model’s template before inference. -
stream: falseasks for one final JSON response instead of partial response chunks. The model can still generate incrementally; the server accumulates the chunks before responding. This is visible in the 0.20.7 generate handler, and documented in the Generate API. -
keep_alive: "15m"asks Ollama to retain the model in memory for 15 minutes after the request, making a near-term follow-up eligible to avoid a cold load. The API value overrides the server default. Ollama FAQ: keeping models loaded -
num_ctx: 4096reserves a 4,096-token context window: the maximum token history the model can access for this request. More context costs more memory. Ollama: context length -
num_predict: 128caps the requested generated-token budget at 128; the model may stop earlier. -
temperature: 0asks for non-random, greedy-style selection rather than deliberately varied sampling. -
seed: 42fixes the sampler seed. Together with temperature zero, it makes comparison easier, but it is not a universal promise of byte-for-byte reproducibility across different builds, devices, or future releases.
The public API calls total_duration, load_duration, prompt-evaluation counts/duration, and output-evaluation counts/duration out explicitly. Ollama: Generate API response fields
For this cold request, I recorded:
total duration                  60.973 s
loading / preparation           59.335 s
prompt evaluation               22 tokens in 60.1 ms
generation                      76 tokens in 1.259 s  ≈ 60.4 tokens/s
That first number is end-to-end service time. The 59.335 seconds is Ollama’s load/preparation metric, not a stopwatch around disk reads alone. It can include scheduling, starting or connecting a runner, allocating memory, backend/model initialization, and transfers as well as storage I/O. I would need tracing to apportion it further.
2. Ollama’s server, runner, Linux processes, and threads⌗
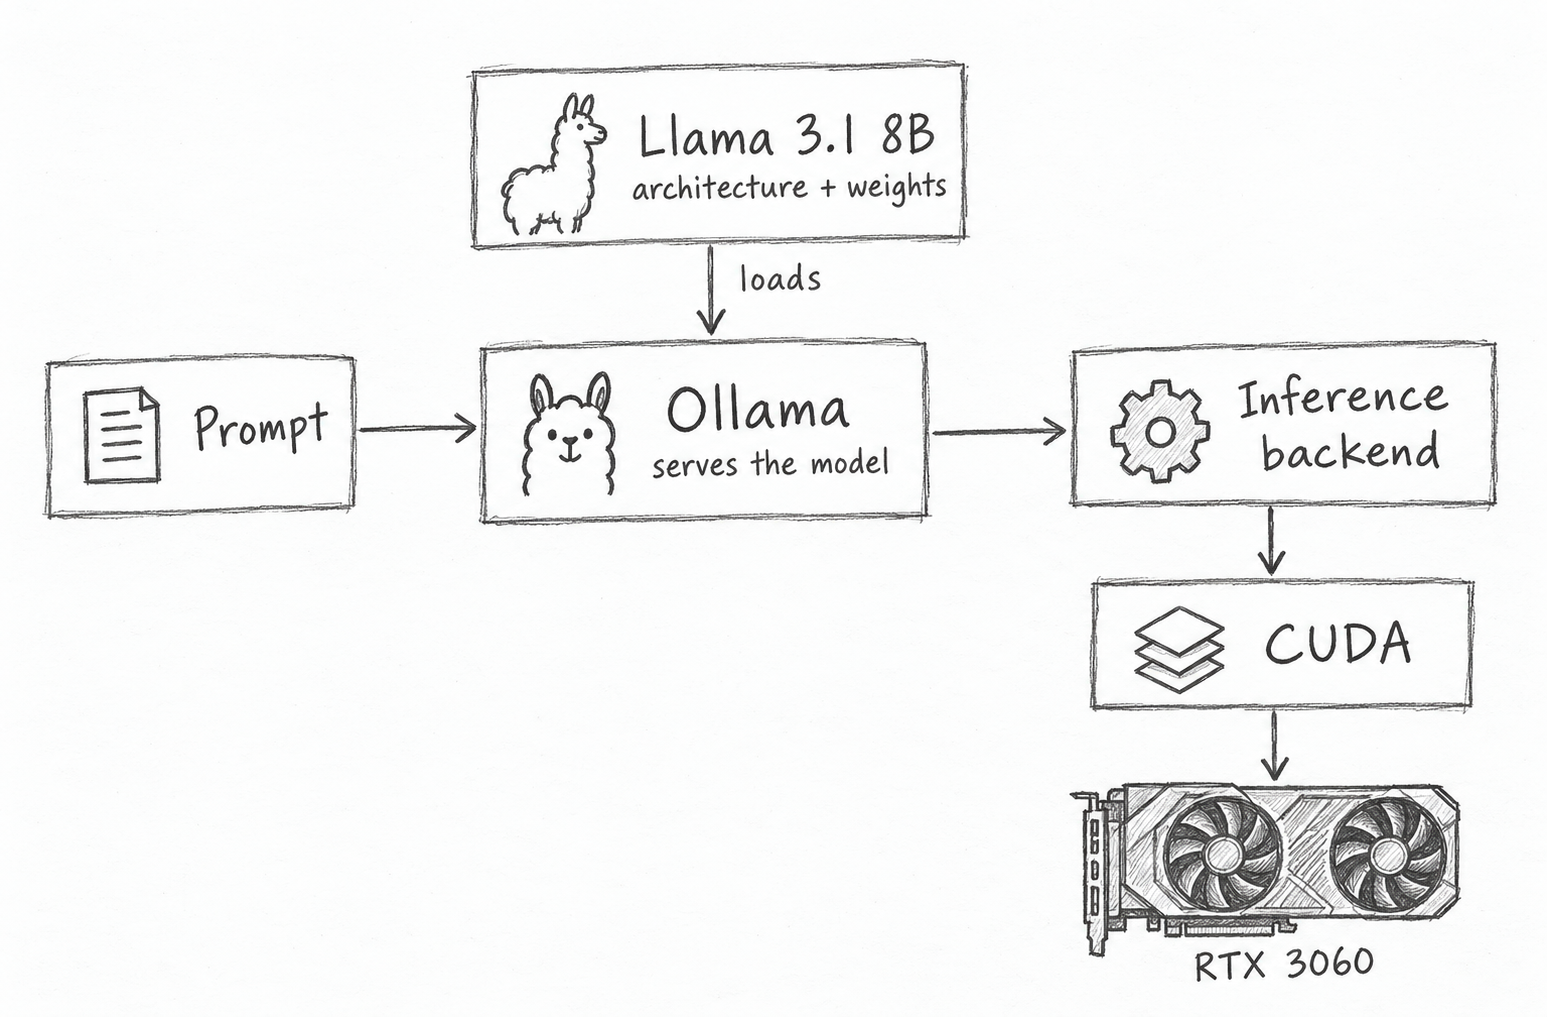
The first useful correction to my mental model was that “Ollama” is not one undifferentiated thing.
For this sample, Linux showed:
ollama server  PID 2010
└─ ollama runner  PID 1966421  (parent PID 2010)
Both processes had 11 Linux threads at the instant I sampled them. A Linux thread is an OS scheduling unit inside a process: for example, it may run Go runtime work, HTTP handling, polling, or native backend code.
That count is not the count of CUDA threads. CUDA threads are tiny GPU execution lanes created by a kernel launch; they are grouped into blocks and scheduled on SMs. Nor is a CUDA block a Linux process. They sit on completely different sides of the driver boundary.
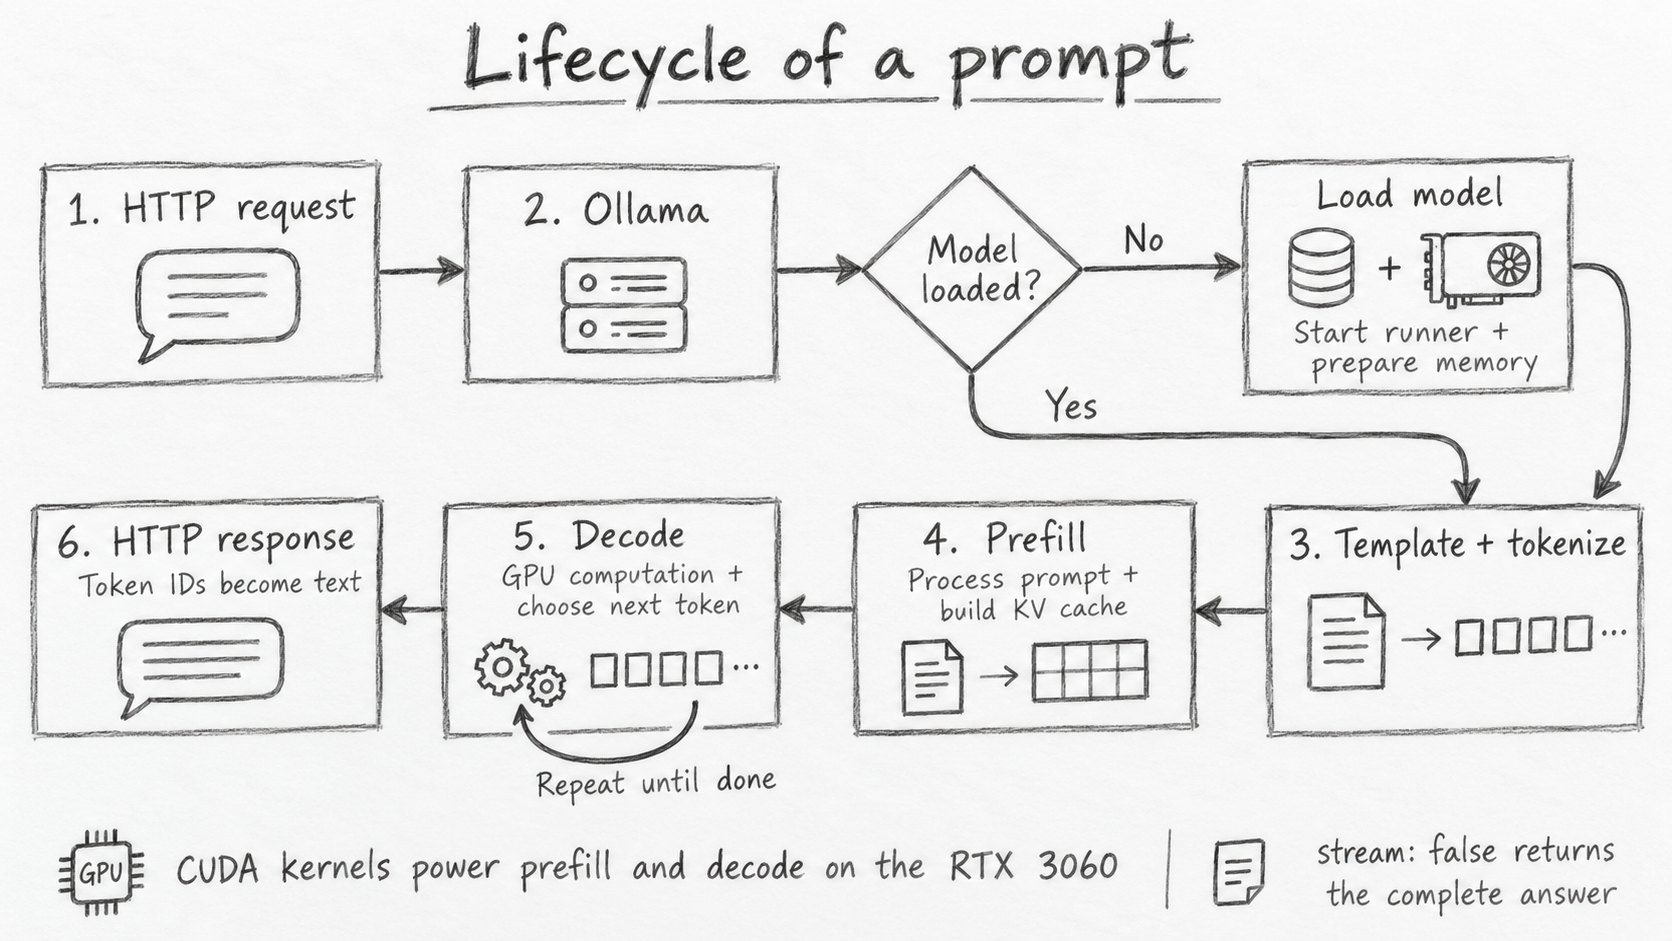
At a high level, the server accepts and validates the HTTP request, chooses or reuses a runner, renders the request, and sends back HTTP. The runner is the inference-serving child that performs model execution through the selected backend. The version-tagged source shows the server consolidating model/request options, asking the scheduler for a runner, then invoking completion on it. Ollama 0.20.7: scheduling and options and completion call.
The process tree proves that a child runner existed with parent 2010. It does not tell me whether that child was created with fork(), clone(), posix_spawn(), or another mechanism. strace -f or audit data is needed for that claim; I do not make it here.
3. Loading model weights from storage into RAM and VRAM⌗
After the request, ollama ps reported the model as 100% GPU with a 4,096-token context. It reported 5,374 MiB allocated to the runner. That is strong evidence that this configuration fit and was fully offloaded, not a claim that every byte in the process or every GPU allocation is model weight.
The useful physical picture is:
model files on storage  →  host RAM / OS page cache  →  GPU VRAM
                                      ↘ metadata, CPU-side work
Model weights are the learned numeric arrays that dominate the static footprint. The runner must make them available to its inference backend. On a fully GPU-offloaded run, the relevant tensors are placed in GPU memory so the GPU can use them without repeatedly crossing PCIe for each operation. The runner also needs working memory for the execution graph and a KV cache, which I will meet shortly.
The exact balance between file mapping, reads, host buffers, driver allocations, and transfers is verify locally territory. The observation I have is “59.335 seconds of loading/preparation,” not a disk-throughput measurement. In particular, I cannot honestly turn that duration into “the SSD took 59 seconds.”
4. Templates, tokenization, embeddings, and prefill⌗
The plain prompt string is not immediately a GPU calculation.
First, Ollama normally applies the model’s prompt template. A template adds the model-specific conversation markers and indicates that it is the assistant’s turn to answer. In 0.20.7, the generate handler uses the model template unless raw is set, constructs a user message, and renders a prompt before calling completion. Ollama 0.20.7: template path
Then the tokenizer converts that rendered text into integer token IDs. A token is a piece of text, not reliably one word: it might be a word, punctuation, or part of a word. The 22 measured prompt tokens count this model-facing representation; it need not equal the number of whitespace-separated words in my original sentence.
Each token ID is looked up in an embedding table, turning the integer into a vector of numbers the network can process. The runner evaluates the prompt tokens together in a phase usually called prefill. Prefill builds the initial attention state and stores the useful past information in the key/value cache. Here, 22 prompt tokens took 60.1 ms.
“Together” is deliberately not “one kernel.” An inference backend builds a computation graph and may launch many kernels—matrix operations, normalisation, attention-related work, copies, and more. The exact launch sequence depends on model, backend, build, shapes, and runtime choices. A GPU profiler is what would establish the sequence on this host.
5. CUDA contexts, kernels, grids, blocks, warps, SMs, and memory⌗
This is where the vocabulary gets dense, so I prefer a small map over pretending all of it is the same thing.
- A CUDA context is driver-managed state that lets a host process use a GPU: allocations, modules, streams, and more live in that world. I expect the CUDA backend used by the runner to establish/use a context, but the number and timing of contexts on this installation requires verification.
- A kernel is a function launched from CPU-side code to execute on the GPU. One high-level model operation can require multiple kernels; a kernel can also implement work from more than one conceptual step.
- A kernel launch defines a grid of blocks. A block is a cooperating group of CUDA threads, not a process.
- NVIDIA executes threads in warps, usually 32 threads travelling through instructions together. Again: these are GPU lanes, unrelated to the 11 Linux threads I saw.
- An SM (streaming multiprocessor) is a hardware worker on the GPU that schedules and executes blocks/warps. This RTX 3060 has 28 SMs.
For inference, the runner asks CUDA software to launch kernels. The CUDA driver sends that work to the RTX 3060; the GPU schedules blocks onto its SMs and reads/writes VRAM. Global VRAM holds large data such as weights and cache buffers. The GPU also has much smaller, faster on-chip memories and registers, which kernels use according to their implementation.
Compute capability 8.6 identifies the GPU architecture target exposed by CUDA. It is useful compatibility context, not a performance result on its own.
6. KV cache, iterative decoding, token selection, and returning text⌗
Attention lets a transformer use earlier tokens while processing the current one. Recomputing the full history from scratch for every output token would be wasteful. The KV cache saves the “keys” and “values” produced for previous tokens so later steps can reuse them.
After prefill, generation becomes iterative:
- The backend evaluates the current sequence state and produces scores—logits—for possible next tokens.
- The sampling policy selects one token. With the settings above, temperature zero and seed 42 keep this test intentionally restrained.
- The selected token is appended to the sequence and its key/value state is added to the cache.
- The process repeats until the model emits a stop condition or reaches the output limit.
- Token IDs are detokenized into text. The runner returns response chunks to the server; with
stream: false, the server collects them into one JSON response.
The measured output was 76 tokens in 1.259 seconds, about 60.4 tokens per second. That rate describes this one response’s decode interval. It does not include the cold-load time and should not be advertised as a general RTX 3060 benchmark.
The cache also explains a subtle warm-path possibility: repeated prompts or conversations with a shared prefix may reuse cached prompt state, reducing the prompt work. Whether a particular request qualifies, and how much state 0.20.7 reused in this setup, needs a controlled repeated-request capture. Newer API documentation exposes prompt_eval_cached_count, a useful field when available. Ollama: Generate API
7. Cold versus warm requests, and what remains afterward⌗
My first request was cold because no model was loaded before it. Its 60.973-second total was overwhelmingly preparation/loading time; prompt evaluation and 76-token generation together were roughly 1.319 seconds.
With keep_alive: "15m", the expected next state is not “everything disappears when HTTP returns.” The runner/model can remain resident and visible in ollama ps until the keep-alive expiry or another scheduling decision unloads it. On this test, that resident state was:
PROCESSOR: 100% GPU
CONTEXT:   4096 tokens
runner allocation observed: 5,374 MiB
A warm request can skip the costly model-load path while the model is resident. It still has to accept HTTP, render/tokenize the prompt, run prefill for uncached input, decode tokens, and return the response. A warm request is therefore “less work,” not “no work.” After 15 minutes of idleness, the model may be unloaded and the next request may again pay a cold-start cost. Ollama documents five minutes as the default and allows each API request to override it with keep_alive. Ollama FAQ: model residency
What I would measure next⌗
The following commands add evidence without pretending the current observations are more precise than they are. Run them on the Linux host while the model is idle, during a cold request, and during a warm repeat. They are read-only except for the intentionally sent test request.
# Ollama's view: loaded model, offload split, context, expiry
ollama ps

# Linux process tree and Linux thread counts (not CUDA-thread counts)
ps -o pid,ppid,nlwp,stat,cmd -p 2010,1966421
ps -T -p 2010
ps -T -p 1966421

# GPU allocations and processes; sample it while the request runs
nvidia-smi --query-gpu=name,memory.used,memory.total --format=csv,noheader
nvidia-smi pmon -c 1

# Record the full JSON timing fields from the same request shape
curl -s http://127.0.0.1:11434/api/generate \
  -H 'Content-Type: application/json' \
  -d @request.json | jq '{total_duration,load_duration,prompt_eval_count,prompt_eval_duration,eval_count,eval_duration}'

# Establish process-creation syscalls only if needed. This is intrusive enough
# to use in a short, isolated test window.
sudo strace -ff -e trace=process -p 2010
For CUDA context and kernel-level evidence, I would capture an Nsight Systems trace in a controlled run, then inspect launches, streams, memory copies, and CPU/GPU overlap. That is the right tool to answer “which kernels actually ran?” It is not something I can infer from ps, ollama ps, or a duration field.
Near the bottom of this investigation, the whole journey finally looks ordinary again: a request crosses a server boundary, a scheduled worker executes a graph, a driver submits work to hardware, and measured timings tell me where to look next.
Version note: the observations are from Ollama 0.20.7. The source links above are pinned to that tag where implementation behavior is discussed; public documentation can describe newer releases. Re-run the measurements after upgrading.