Predicting Disk Failures with a Small LLM, Part 1: A Working Pipeline and a Useless Model
Table of Contents
Most hardware I have operated tells me only part of what is happening inside it. A disk reports a handful of counters. A switch reports interface errors. A GPU reports temperature and a few error codes. The interesting physics, firmware decisions and wear sit underneath, and I mostly see their side effects.
I wanted to know how far those side effects can take you. Can a model look at a week of a drive’s self-reported telemetry and say whether it will fail soon? And can a small language model, fine-tuned on my own GPU, learn to do that?
This post covers the first attempt. The pipeline works end to end. The model it produced does not predict anything useful. Both results are worth writing down.
Why disk failure is hard to predict⌗
A drive’s failure depends on things the telemetry only partly captures:
- Workload. The same drive model behaves differently under a backup archive than under a busy database.
- Hardware design and firmware. Vendors decide which events to count, when to remap a sector, and what each SMART attribute means. The same attribute number can carry different semantics across vendors.
- Age. Wear accumulates, but early-life failures also exist.
- Temperature and operating conditions. Heat, vibration, power events and the chassis a drive sits in all matter, and only some of it is recorded.
It also matters what kind of device we are talking about.
Mechanical hard drives have spinning platters, moving heads and motors. Many failures develop gradually: the surface degrades, sectors become hard to read, and the drive remaps them. Counters such as reallocated and pending sectors can rise before the drive dies. Some failures, such as a head crash or a motor or electronics fault, are sudden and may leave little trace in SMART beforehand.
Semiconductor devices such as SSDs have no moving parts. NAND flash wears with program/erase cycles, which drives expose through wear and spare-block indicators. But controller or firmware faults can take a device down abruptly, and the attributes that matter are different and often vendor-specific. A model trained on hard drive counters says nothing about SSDs.
This series stays with mechanical drives, because that is where the public data is deepest.
The data: Backblaze Drive Stats⌗
Backblaze publishes daily snapshots of every drive in its data centers: model, serial number, capacity, a failure flag, and raw and normalized SMART values. I used Q1 2025, which is 90 daily CSV files in one archive (data_Q1_2025.zip, about 1 GB).
Mixing drive models would mix vendors’ SMART semantics, so I picked one model: the Toshiba MG07ACA14TA, a 14 TB drive with a large population in the fleet. Filtering the quarter to that model gave:
- 3,385,931 daily observations
- 133 unique drives that failed during the quarter
From each daily row I kept seven raw SMART fields:
| SMART ID | Common meaning |
|---|---|
| 5 | Reallocated sectors count |
| 9 | Power-on hours |
| 194 | Temperature |
| 196 | Reallocation event count |
| 197 | Current pending sector count |
| 198 | Offline uncorrectable sectors |
| 199 | UDMA CRC error count |
Most of these describe the media surface, plus age, heat and cabling errors. That is a narrow window into the drive, and it is deliberate. I wanted to start with the counters people usually watch.
Framing the prediction task⌗
The question I gave the model:
Given seven consecutive daily observations of one drive, will it fail during the following seven days?
The answer is a single JSON object:
{"failure_within_7_days": true}
How the examples are built matters more than the model, so I was strict about it:
- One example per drive. A drive that contributes many overlapping windows would dominate training and could leak between splits.
- Positive examples end one to seven days before the recorded failure. The history never includes the failure day itself, so the model cannot see the event it is supposed to predict.
- Negative examples need a complete seven-day follow-up without failure. A drive that disappears from the data three days later is not a confirmed healthy example.
- Histories with missing selected SMART values are rejected. I would rather have fewer examples than teach the model to read gaps.
- Serial numbers and failure flags are excluded from the input. Either would let the model cheat.
- Splits are by drive, stratified, and random. No drive appears in more than one split. The split is not chronological, which I will come back to.
- Healthy drives are sampled. Using every healthy drive would make failures vanishingly rare. The price is that my test set has far more failures than the real fleet, so its accuracy numbers do not transfer to production.
The examples are stored as JSONL in Alpaca format, with instruction, input and output fields.
| File | Examples | Failures |
|---|---|---|
train.jsonl |
779 | 79 |
val.jsonl |
167 | 17 |
test.jsonl |
168 | 18 |
That is 114 usable failed drives out of 133. The rest were lost to the missing-value and window rules.
The local setup⌗
Everything ran on my Linux box:
- NVIDIA RTX 3060 with 12 GB VRAM (11.63 GiB usable), 16 GB RAM
- Python 3.12.3, PyTorch 2.14.1+cu130
- Soup 0.75.2 (the
soup-clipackage), which wraps Transformers, PEFT and TRL behind one YAML config - Workspace and Hugging Face cache on
/srv/storage, so model downloads don’t fill the system disk:
export HF_HOME=/srv/storage/backblaze-soup/models/huggingface
soup doctor
soup doctor checks the Python, CUDA and library versions before you spend time on a run. It is worth running after every environment change. I learned that later, the hard way.
Fine-tuning Qwen2.5-1.5B with QLoRA⌗
I chose Qwen2.5-1.5B-Instruct: small enough to train comfortably on a 3060, and already good at following a “reply with JSON” instruction.
Full fine-tuning of 1.5 billion parameters does not fit in 12 GB. QLoRA makes it fit. The base weights are loaded in 4-bit and frozen, and only small low-rank adapter matrices are trained. The adapter is a few megabytes, and the original model stays untouched.
This is the whole configuration:
base: Qwen/Qwen2.5-1.5B-Instruct
task: sft
backend: transformers
data:
  train: /srv/storage/backblaze-soup/data/train.jsonl
  format: alpaca
  val_split: 0.1
  max_length: 2048
  train_on_responses_only: true
training:
  epochs: 1
  lr: 0.0001
  batch_size: 1
  gradient_accumulation_steps: 8
  gradient_checkpointing: true
  quantization: 4bit
  seed: 42
  data_seed: 42
  logging_steps: 5
  save_steps: 100
lora:
  r: 16
  alpha: 32
  dropout: 0.05
  target_modules: auto
output: /srv/storage/backblaze-soup/output/qwen-backblaze-v1
A few choices worth explaining:
- Batch size 1 with gradient accumulation 8 gives an effective batch of 8 without holding eight long sequences in memory at once.
- Gradient checkpointing recomputes activations during the backward pass instead of storing them. It is slower, but it saves memory.
train_on_responses_onlycomputes loss only on the answer, not on the long SMART history in the prompt. I want the model graded on its prediction, not on copying numbers.val_split: 0.1means Soup held back 10% oftrain.jsonlfor its own validation. My separateval.jsonlwas not used during training.
soup train --config soup.yaml
The run took 88 optimizer steps and about six minutes, with GPU memory peaking around 3.5 GB. I did not enable layer streaming. The reported loss fell from 1.0847 to 0.0198.
To see what the GPU was doing during that run, I later reran exactly the same configuration into a separate output folder and watched it in Grafana, with nvidia-smi sampling once per second alongside. The rerun matched closely: 88 steps, 408 seconds of training (about eight minutes including model and data loading), and loss from 1.0812 to 0.0198. The first logged loss differs slightly from the original 1.0847, a reminder that a fixed seed does not guarantee bit-identical GPU runs.
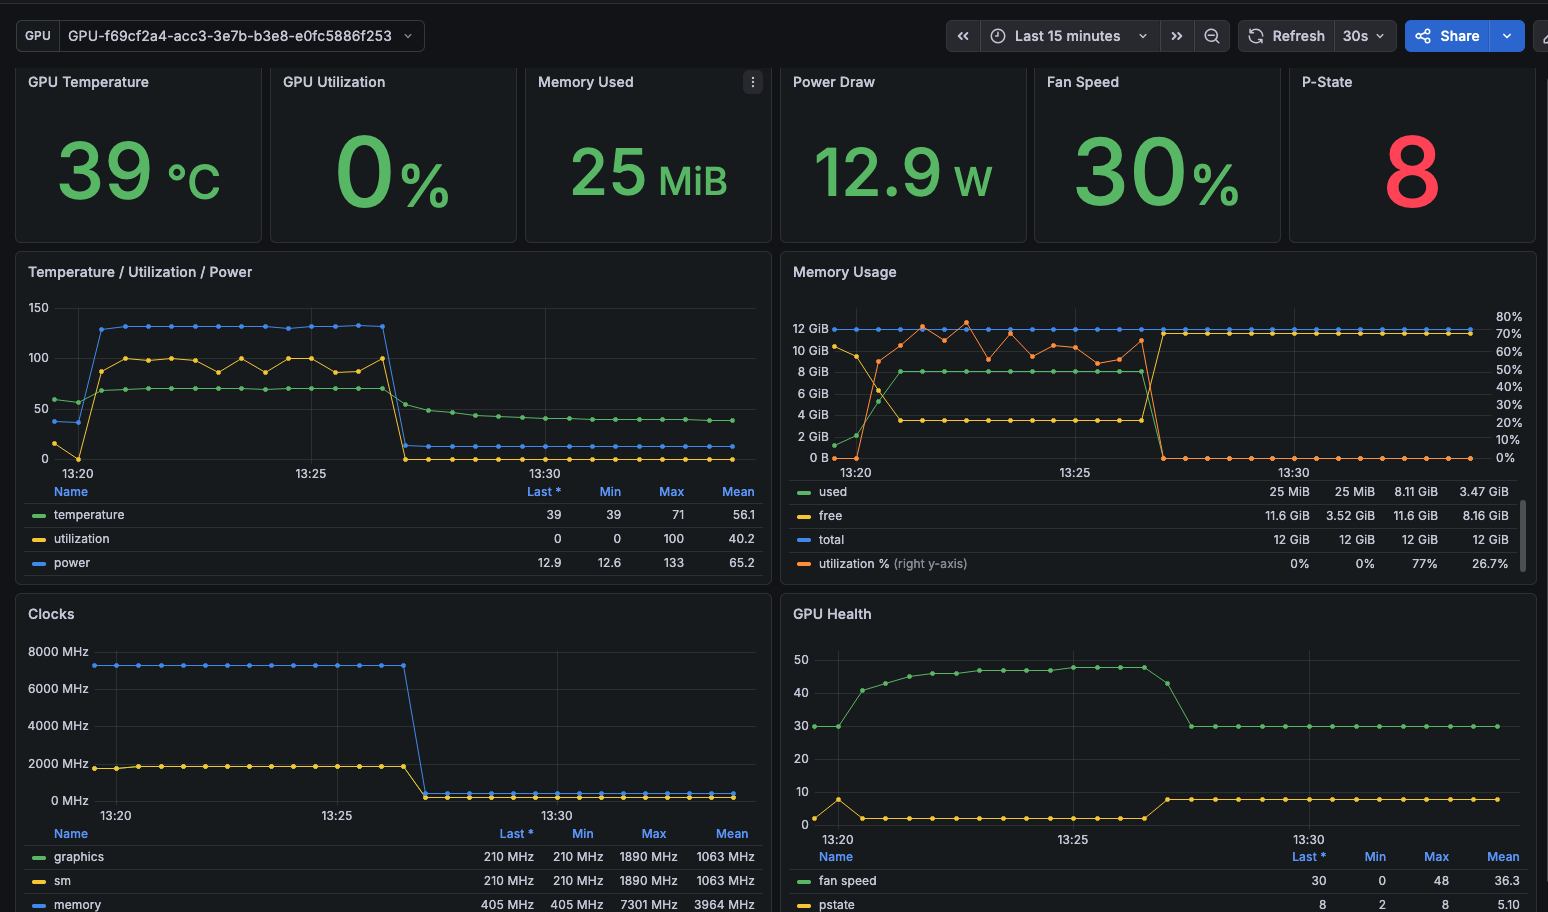
Two things stand out. Soup reported a 3.5 GB peak, but the GPU showed up to 8.1 GiB in use. My reading is that Soup reports memory PyTorch allocated for tensors, while the driver also counts the CUDA context and memory PyTorch’s caching allocator has reserved but not handed out. Both numbers are real; they answer different questions. The card was also busy without being maxed out: once training started, utilization averaged about 92%, power peaked at 133 W against a 170 W limit, and temperature rose from 59 °C to 71 °C. For a 1.5B model in 4-bit with batch size 1, the 3060 has headroom.
On paper, that looks like success.
Evaluating it⌗
I ran the 168 test examples through the fine-tuned adapter and through the original model, then compared the answers with the labels.
The fine-tuned model returned valid, bare JSON for all 168 cases. It also answered false for all 168:
| Predicted failure | Predicted healthy | |
|---|---|---|
| Actually failed | 0 | 18 |
| Actually healthy | 0 | 150 |
Accuracy was 89.3%. Failure recall was 0%. A model that always says “no failure” gets exactly the same score, because 150 of the 168 test drives are healthy. The fine-tuned model learned the answer format and the majority class, and missed every drive that actually failed.
A bug in my own evaluation⌗
The original model at first looked even worse: my script marked all of its answers invalid. When I inspected the first five, each was perfectly reasonable JSON, wrapped in a Markdown code block:
```json
{
  "failure_within_7_days": false
}
```
My parser expected bare JSON and rejected the fences. So “0% valid” described my evaluation code, not the model. Those five answers all predicted false too, but five answers are not a baseline, and the full corrected comparison is still pending.
What I take from this⌗
- Local fine-tuning is accessible. A consumer GPU, a 1.5B model and QLoRA got me from raw CSVs to a trained adapter on one machine, and the training run itself took six minutes.
- A low training loss is not a useful predictor. With 90% healthy examples and a tiny fixed answer, the cheapest way to reduce loss is to always say no.
- Valid JSON is not a useful predictor either. Format compliance is easy to measure and easy to mistake for progress.
- Accuracy is the wrong headline metric for rare events. I’ll report failure recall, precision and false alerts from now on.
Next⌗
I’ve built a balanced training set with 79 failed and 79 healthy drives, so “always no” stops being a free win. The plan is to train a fresh adapter from the original base model for three epochs on it, and to compare it on the validation set rather than repeatedly on the test set. I also want a tabular baseline, such as XGBoost or LightGBM on the same features, to see whether a language model adds anything at all. Last, I want an evaluation on a later time period before drawing any operational conclusions.
That second training run has not produced a result yet.